


Back in 2014, the Danish Refugee Council’s Joint IDP (Internally Displaced Persons) Profiling Service (JIPS) turned to SpatialDev to create a visualization tool for its data. Developer Adam Roberts tells us more about JIPS and the Dynamic Analysis and Reporting Tool (DART) we created.
Who is JIPS?
The Joint IDP Profiling Service (JIPS) is an inter-agency service based in Geneva. They primarily focus on technical support to government, humanitarian, and development groups who need help improving the quality and efficiency of their data on internally displaced populations.
They:
- Provide field support, technical advice, training and capacity building for groups who are collecting or managing IDP data
- Develop tools (like the DART) and guidance materials to guide groups to needed resources
- Advocate for IDP data quality
What did JIPS want in a tool?
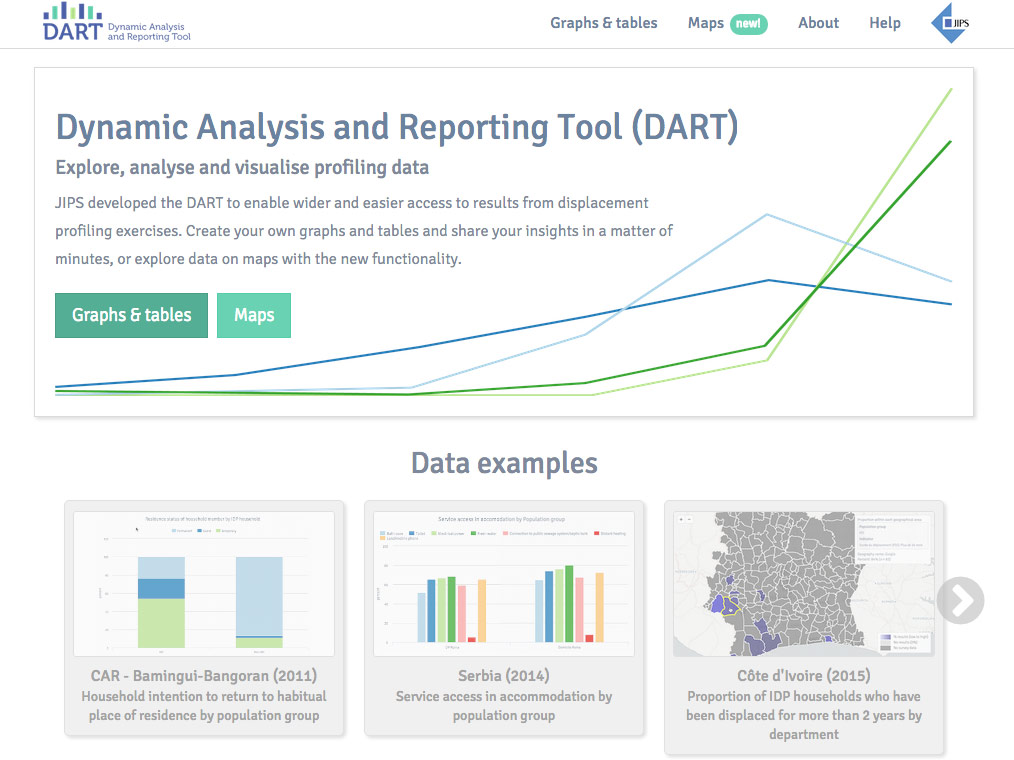
Data can be analyzed and explored from many angles, but a PDF report can only contain the views that were analyzed for the report – no others are seen or available to analysts or the public. JIPS wanted SpatialDev to create a tool that allowed profiling data they help to collect live beyond the report.
More specifically, the DART aims to:
- Provide access to profiling data
- Facilitate analysis and reporting of profiling data
- Encourage collaboration to promote effective use and continued sharing of profiling data
- Provide examples of data analysis and visualization best practices
What does DART do?
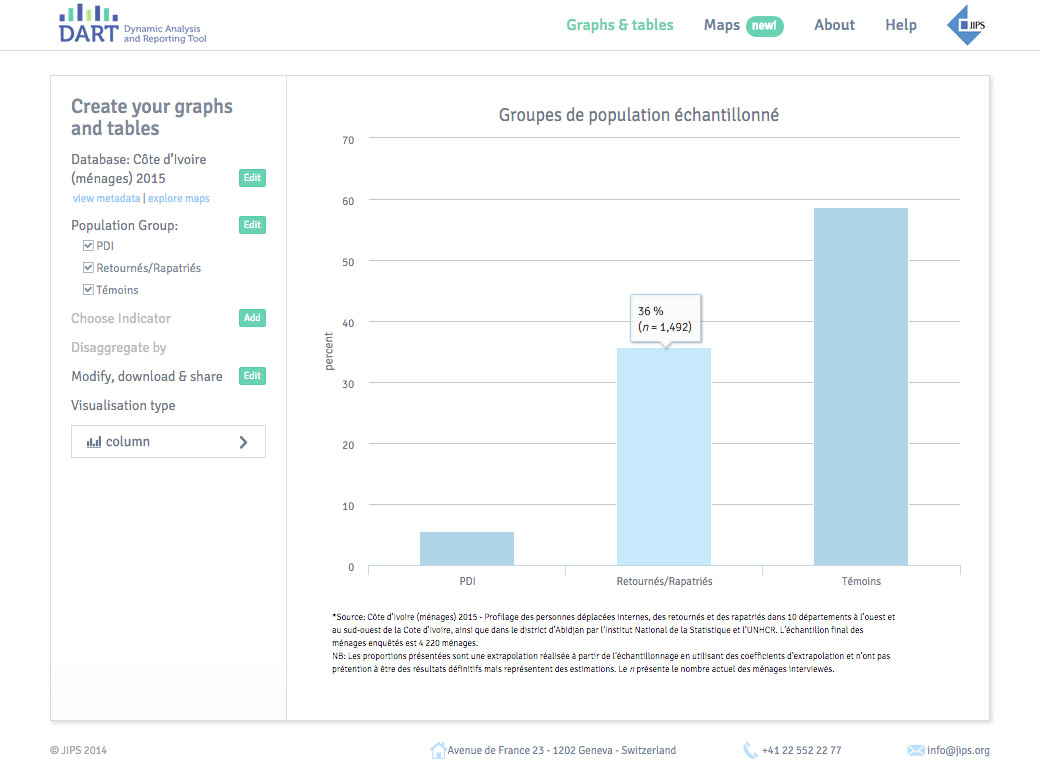
The DART is a tool that streamlines and normalizes the diverse range of profiling survey data into a format that can be explored through a core set of visualization and exploration options. More specifically, it:
- Houses profiling survey data
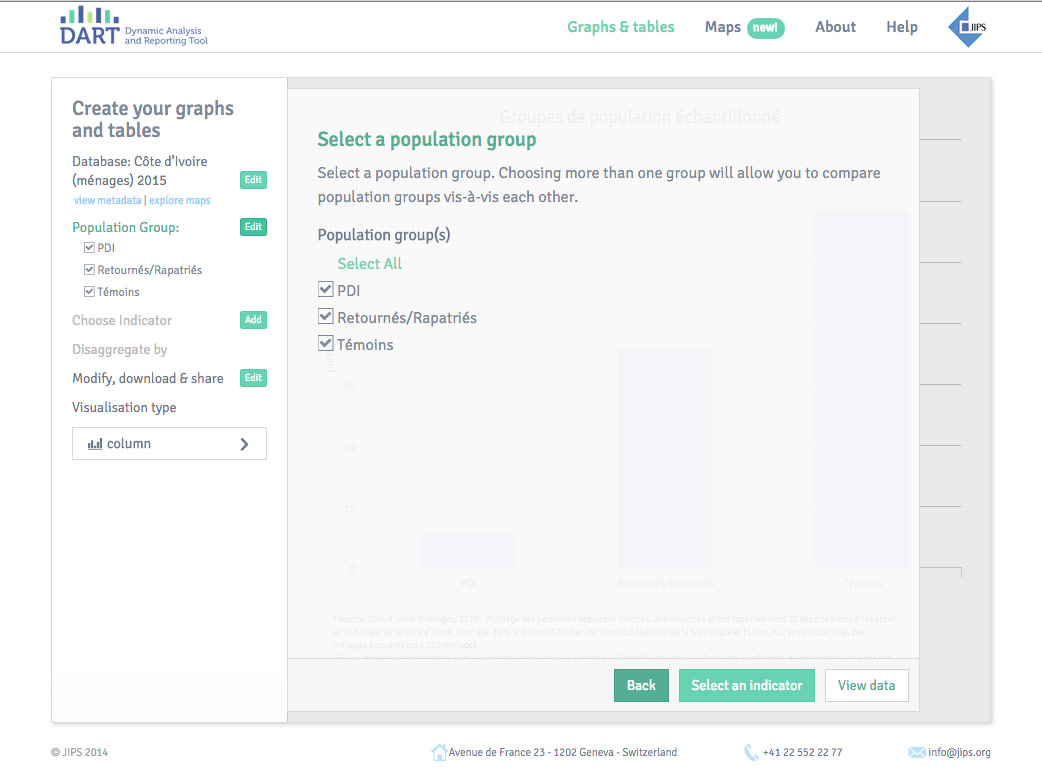
- Allows users to explore different angles of the data
- Allows for the creation of report-ready charts and tables
- Allows for public, unrestricted access to the profiling survey datasets
Who is using the app and how is it helping?
The DART is most useful for groups who are actively collecting and managing profiling data for internally displaced persons. It is most beneficial to program managers and policy-makers who can benefit from straightforward, direct access to population data to support advocacy, programming, and policy-making decisions.
How was the tool built?
The app is built using node.js for the server-side routing, and angular.js for the client-side views. Since the survey data can be very large, having a robust database is important as well, which is why we are using PostgreSQL to manage all the survey data. We’re using highcharts.js (charts) and leaflet.js (map) for the visualizations – both well-used libraries that offer clean presentation of the data. Angular is well suited for the app because we can efficiently present a single-page application as a multi-page site, keeping our builds and deploys clean. And Angular’s binding of scope to view enables convenient pre-selections when a chart or map is linked directly. We’re also employing a SpatialDev approach to Angular UI-router, which we use to build and maintain selections though URL parameters. This makes all our modifications directly linkable – a benefit when sharing user-customized visualizations
e.g. : http://dart.jips.org/visualizedataset=serbia&topic=Housing&analyse1=service_access&analyse1Filters=Bathroom%20,Toilet,Fresh%20water,Connection%20to%20public%20sewage%20system%252Fseptic%20tank&viztype=bar.
Resources:
JIPS post about DART:
http://www.jips.org/en/news/latest-news/introducing-the-dart
DART about: http://dart.jips.org/about