


Written by: Savannah Ostrowski
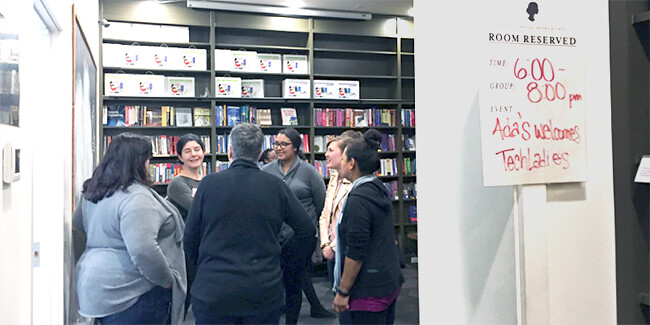
This past weekend a few of us (Stephen, Daniel, and Savannah) mentored the MapHacks hackathon at the University of Washington, organized by the University’s Department of Geography and sponsored by Critigen.
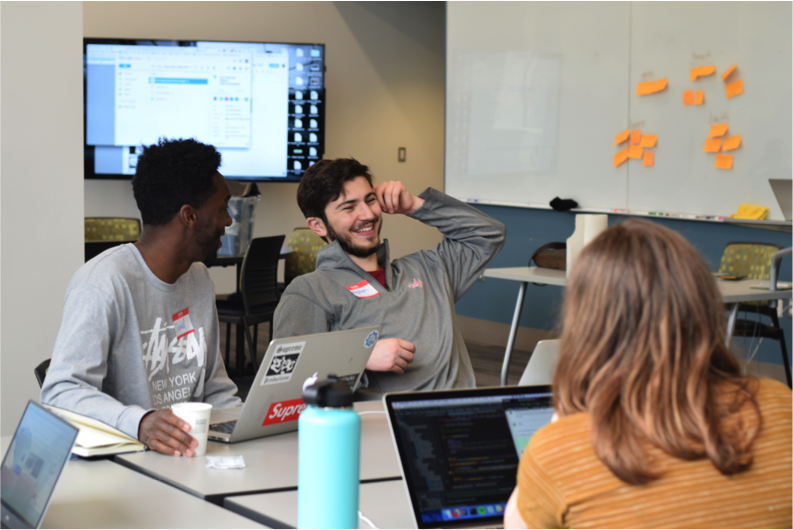 Photo credits: Utako Kase
If you’re unfamiliar with the concept of a hackathon, rest assured it’s super fun! A hackathon is an event where people come together, form teams and work to build a project with the goal of addressing some problem or topic. Hackathons are a great time to try out something new, whether it’s a new framework or method of analysis.
In the case of UW MapHacks, students from all disciplines were tasked with building an urban, geography-focused project exploring topics such as location, distance, space, spatial patterns, spatial interactions, scale, nature and/or society. Their projects were judged with four main criteria in mind:
1. Cartography and Design - How did the project convey the idea?
2. Urban Issues - To what extent is the urban topic being addressed?
3. Learning - Where did the team start? What did the students learn along the way? Where could the project have gone if they were given more time?
4. Implementation - To what degree did the team implement the project?
The hackathon spanned both Saturday and Sunday, with development and analysis happening on Saturday and judging happening on Sunday. On Saturday, the mentors helped students to zero in, and narrow down their topics. One of the common hurdles that groups had to overcome was finding data…and then cleaning it. Because data collection is always laborious in a spatial data project, idea refinement was paramount in making sure that groups were moving toward project implementation - it was a two-day hackathon after all!
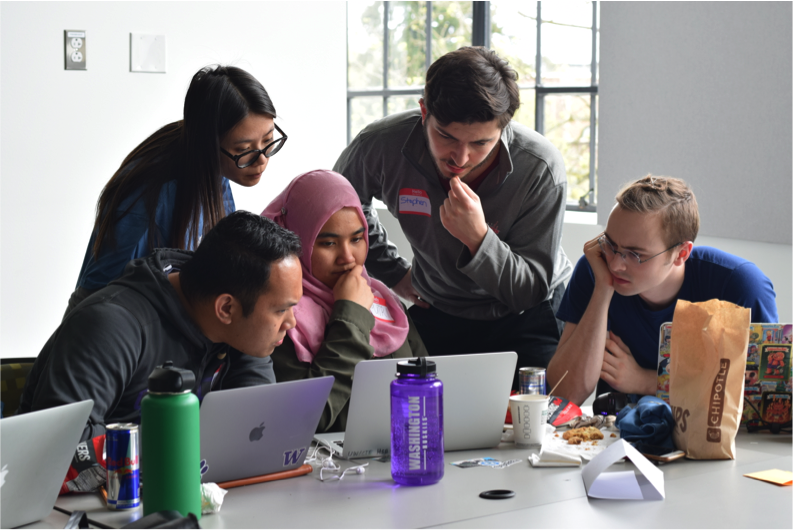 Photo credits: Utako Kase
Groups addressed questions such as: How is accessing groceries related to income in Seattle? Where in King County, WA has the highest risk for respiratory illness? Where is the best location for a new link transit station? It was awesome to see students, both in the Geography department and from other disciplines, show an interest in GIS and see the relevance of using geographic data for solving complex problems.
When it came time to present their findings on Sunday, students leveraged technologies including Leaftlet.js and Mapbox Studio to visualize their results. Because of the interdisciplinary nature of the hackathon, some groups not only had to learn about visualization frameworks but also about GIS algorithms such as Location-Allocation and Network Analysis to aggregate their data.
Overall, I was excited to help out that at the hackathon (…and I can safely say the same for Daniel and Stephen!), and can’t wait for the next opportunity mentor the next generation of spatial data enthusiasts!