

Our bread and butter here at SpatialDev is designing and developing powerful data visualization and analytics tools that support sustainable social and economic development around the world. We use geospatial data and mapping technology combined with user-friendly spatial data visualization applications to create tools that are used by organizations around the world to help inform decision making, enable deeper analysis and provide transparency.
We are constantly looking to optimize user experience within our complex, data-heavy applications. We make sure to carve sufficient time within our projects to design and implement UI/UX details that will help with usability of the application. One element that we rely on is animation. We believe that animation, when done correctly, has an important functional role in the usability of our apps.
Animation has always been an integral part of an interactive experience. Animation can enrich an experience, make it more interesting and can keep a user more engaged. It can, however, also be cumbersome, clunky and annoying. By focusing on the functional, subtle aspects of animation and how it can enhance the user experience, we are ensuring that our use of animation is purposeful.
Some examples:
1. GIVING THE USER VISUAL FEEDBACK
Giving users visual feedback creates an exchange between user and the app, giving the user cues as to what is coming next or what they should be doing next.
Redfin uses clusters to show the number of homes on sale at a certain area when the map is zoomed out. This is a nice “quick view” of homes without cluttering up the map too much. As a user zooms in the map, the clusters break into smaller, clusters. Eventually, when the zoom level is close enough, the clusters break out to individual points. The zooming and clustering animation timing helps in understanding the logic in the clusters: when user clicks on zoom button, the first thing that happens is the map zooms, then the clusters reappear only to break into smaller clusters. These smaller clusters spread out from the original cluster into their new positions. This animation of the clusters allows the user to follow the succession of things that are happening.
2. VISUAL CUES OF STATUS
A lot of our applications deal with big datasets, real-time analysis of these datasets and many times in low-bandwidth regions. Getting visible feedback about data loading is critical to ensure the user is aware that things are being loaded and calculated in the backend.
3. GUIDING THE USERS
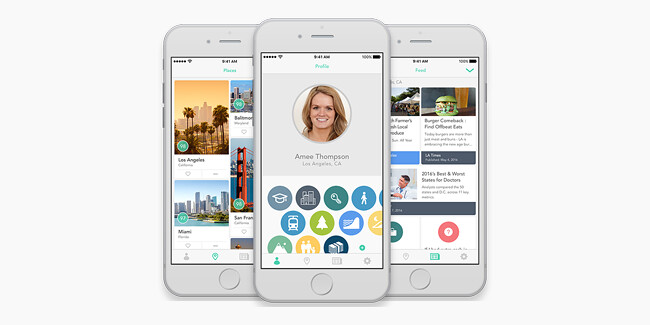
We have been using Google’s Material Design in our apps in the last couple of years. As early adopters of Material Design, we understood and appreciated from the get-go the importance of motion in the material design library, where motion serves a purpose, is efficient and coherent.
In our UW Arborteum interactive map (example above), we leveraged the different Material Design UI elements that have built-in, default animation and transitions. The result is a clean, easy-to-use, intuitive experience.
In conclusion, we continue to use animation as a functional element of our design and user experience in our projects, however we try to make sure that the animations we use are purposeful, helpful and feel natural within our design. We make sure to test with our users all these UX elements and we don’t hesitate to change or improve our design based on user feedback. For additional information about this, read about data-driven design in our post Ballard Seafood Fest Interactive Map.