


The 2016 State of the Map – held July 23 through 25 in Seattle – attracted developers, analysts, and map-users from across the country interested in all things OpenStreetMap. Here were some of the big themes and takeaways:
Mapping in Remote Areas:
Dale Kunce from the American Red Cross really put mapping in perspective. He showed the image below, explaining that most of the developing world and its huge portion of the global population are not on the map.
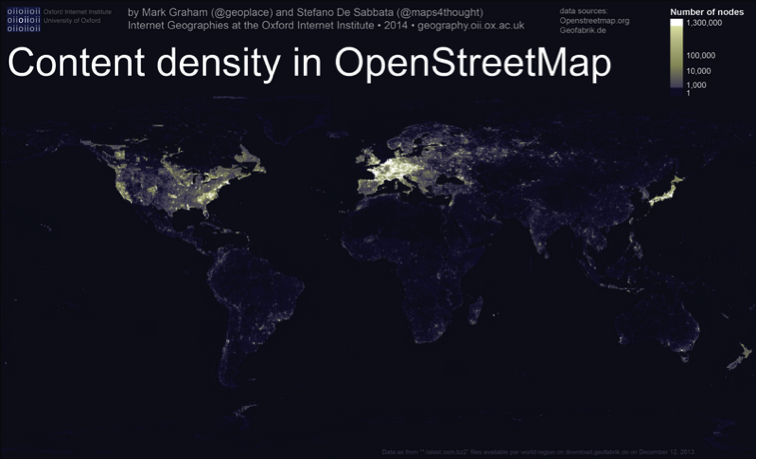
Photo Source: http://www.locusmap.eu/locus-tip-maps-of-the-internet/
He explained that some of the most vulnerable places in the world are also the most under-mapped. Red Cross and Missing Maps have changed the way OpenStreetMap and maps are used during disasters. With mapathons and ground-truthing, the organizations are using OSM data for disaster response (such as for vaccination campaigns). Missing Maps has far surpassed its goal of 10,000 mappers and 20 million people on the map.
Emily Eros from Missing Maps, Nick Hallahan from SpatialDev, and Seth Fitzsimmons from Stamen talked about POSM (Portable OpenStreetMap), a mobile application that Red Cross and Missing Maps use to map buildings, roads, and other important landmarks in remote areas, where even electricity is scarce. POSM allows users to submit custom OpenMapKit forms using the OpenStreetMap tagging schema. The developers on this open source project talked about POSM’s great success in collecting field data in Ecuador, West Africa, and other rural and unmapped regions. They also noted that POSM has many other potential use cases, possibly with government agencies or organizations with proprietary data interested in working with OpenStreetMap software.
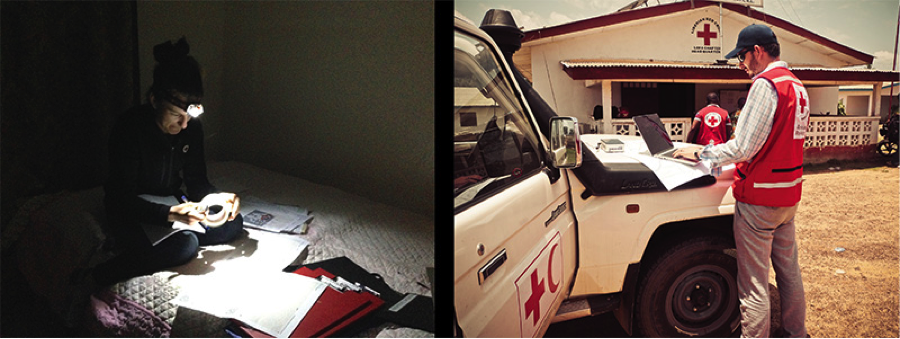 Photo Source: http://www.missingmaps.org/blog/2016/04/25/west-africa-mapping-hub-launch/
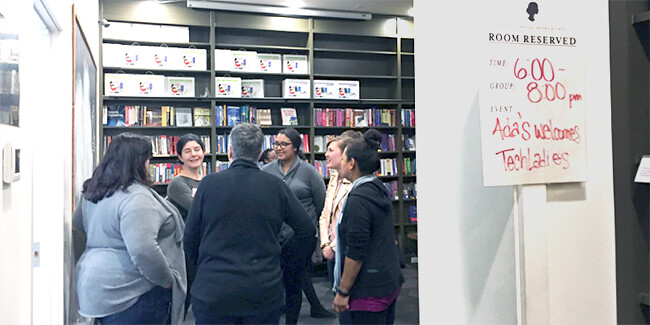
Lindsey Jacks from the Cadasta Foundation talked about Field Papers, and how, even at a time when OpenStreetMap technology is constantly developed and improving, “technology still needs humans”. Field Papers allows mappers to perform fieldwork using a paper copy of OpenStreetMap for a given area, and make edits using a pen. Edits can then be scanned and uploaded to the master OpenStreetMap database. This method is often more efficient when working with rural communities.
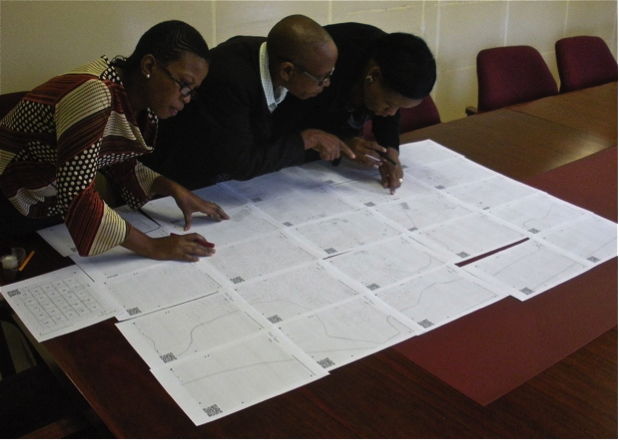 Photo Source: https://github.com/peacecorps/mapping-toolkit
Tyler Radford from HOT (Humanitarian OpenStreetMap Team) perfectly articulated the importance of mapping in remote areas in need. He explained that developing countries often measure success in combating poverty and other issues at the national level – not at the “human level”, or a more drilled down level. Part of the reason for these high-level measurements is the lack of available data – especially spatial data. There is a huge need for disaggregated data in developing countries – and OpenStreetMap data is fulfilling that need. With the ability to map roads, health services, and unplanned settlements, such as the Tanzanian settlement home to 1.3 million people that HOT recently mapped, OpenStreetMap is an effective means of improving data collection and availability in underserved regions.
Visualization and Analysis:
Several groups are using OpenStreetMap data for very cool transportation planning and analysis. Door2Door in Berlin, for example, is developing a mobile app that allows users in East Africa to track their transit routes to work. They then collect this data in OpenStreetMap, often creating the first digital and publically available transit maps in several African cities.
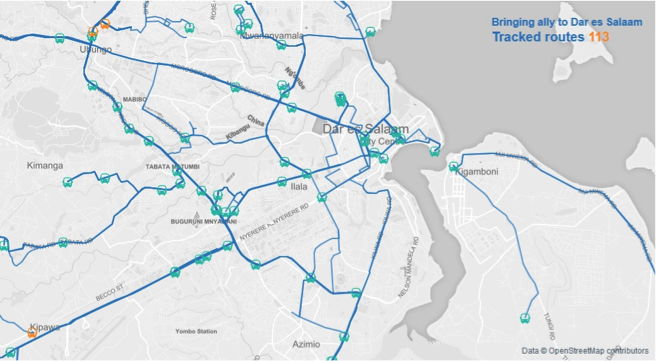 Photo Source: http://www.digital-geography.com/ally-what/
As part of the SOTM program, I gave a presentation about SpatialDev’s experimentation with improving travel time analysis using OpenStreetMap and OpenTripPlanner. These tools are used to create walksheds surrounding businesses and services that allow analysts to understand how many people are within walking distance (for more info check out this article).
Tableau also talked about the process of adding OpenStreetMap data to their basemap using MapServer, and their approach to labeling freeways in an automated, yet visually appealing way.
Other groups talked about the history and current status of OpenStreetMap with visuals and stats. Alan McConchie from Stamen, for example, looked at the almost 3 million OSM users, and made the distinction between who only registered for an account, and who actually made a change to the OpenStreetMap database. He explained that the rate at which OSM edits are occurring is slowing down.
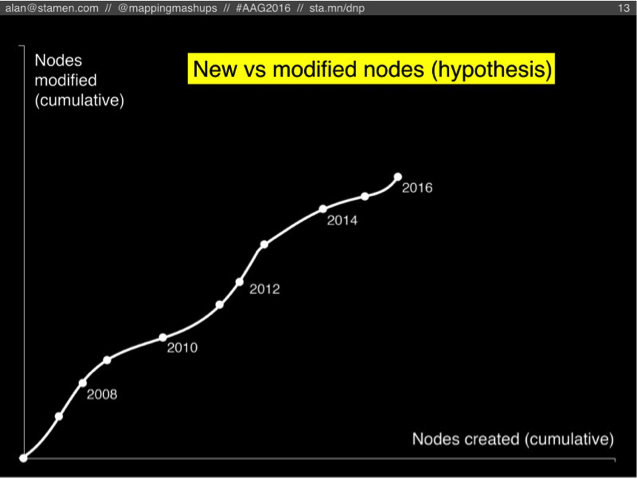 Photo Source: http://mappingmashups.net/
Mikel Maron from Mapbox explained the raw OpenStreetMap stats, including that there are 15,000 users editing OpenStreetMap every week, 3.5 billion nodes in the OSM database, and almost 1,000 edits per week just in the US. Cool visuals with this information can be found at http://osm-analytics.org/#/.
Sanjay Bhangar talked about how Mapbox is cleaning up OpenStreetMap vandalism and errors, such as overlapping buildings, unconnected freeways, or kitty cat shapes drawn using OpenStreetMap geometries. osmlint is one of the tools they use to clean this up.
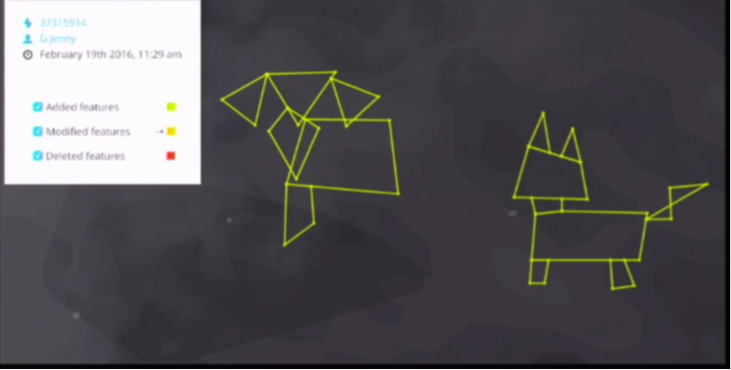 Photo Source: http://stateofthemap.us/2016/validating-the-map/
Sterling Quinn from Penn State University shared a great interactive visual for the enormous amount of OpenStreetMap edit history data, which can be found here: http://sterlingquinn.net/apps/crowdlens/.
Satellite data and Machine learning:
Both Facebook and Development Seed talked about their approach to using satellite imagery and existing OpenStreetMap data for machine learning. Deep Learning helps us perform satellite image classification, and, using training data from OpenStreetMap ground truth data and satellite data, it can automate mapping in OpenStreetMap. Machine learning may be a way to fill in gaps in OpenStreetMap, allowing humans to correct machine edits. Terrapattern and DeepOSM are some examples of OpenStreetMap and machine learning.
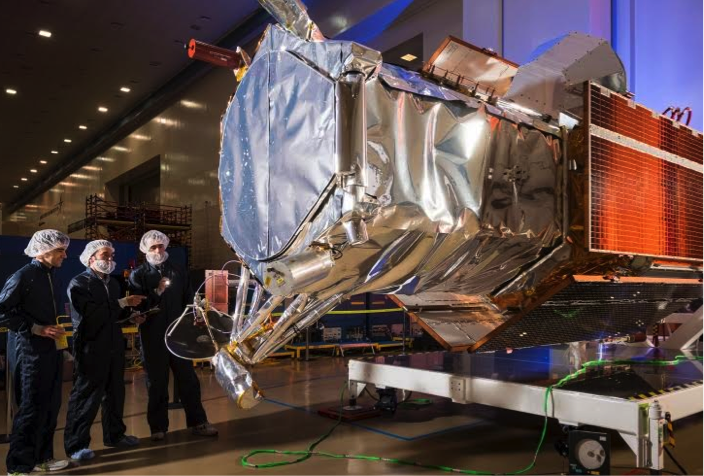 Photo Source: http://spacenews.com/digitalglobe-reports-broad-commercial-growth-ahead-of-worldview-4-launch/
Kevin Bullock talked about DigitalGlobe, and how the company launches satellites into space and downloads imagery, collecting about 70 terabytes of data per day. DigitalGlobe is the source of almost all satellite imagery used in OpenStreetMap.
Of course, there were many more interesting topics discussed at SOTM, and this synopsis does not do them justice. But thankfully, all of the talks were recorded and available on YouTube – check them out on the 2016 State of the Map website, or on this YouTube channel.