


In a previous blog post we described our project to support climate-smart agriculture project through data-informed decision making. Back in September, we identified a number of key questions our clients and community partners were interested in answering:
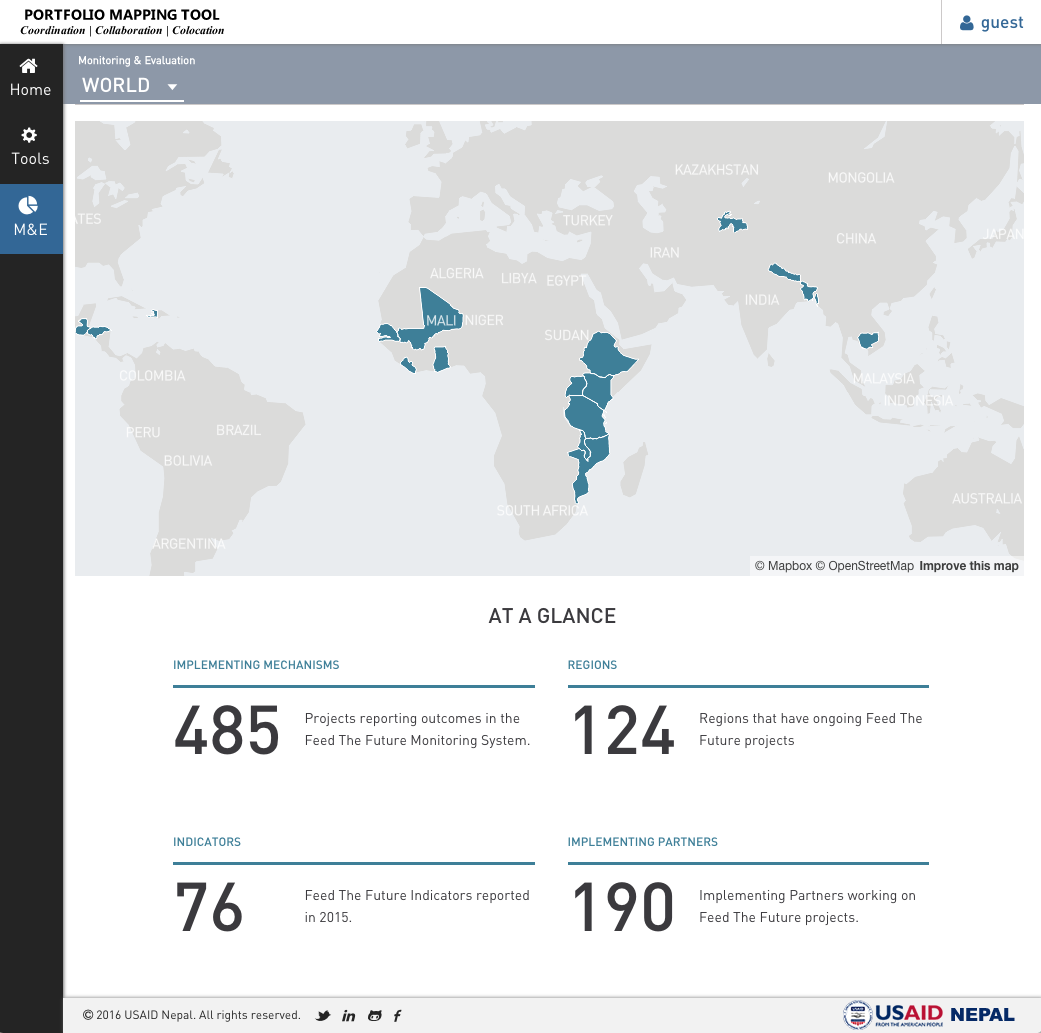
• What is the full geographic extent of the work we are supporting?
• How do our projects fit within the context of other projects occurring in the area?
• How do we know if our projects are having an impact?
Now that we have built a prototype for this project, it is possible to start answering these questions.
First, USAID wanted to understand the full geographic extent of the work they were supporting. Using data from the Feed the Future Monitoring System, it is possible to see that projects are currently occurring in 17 countries.
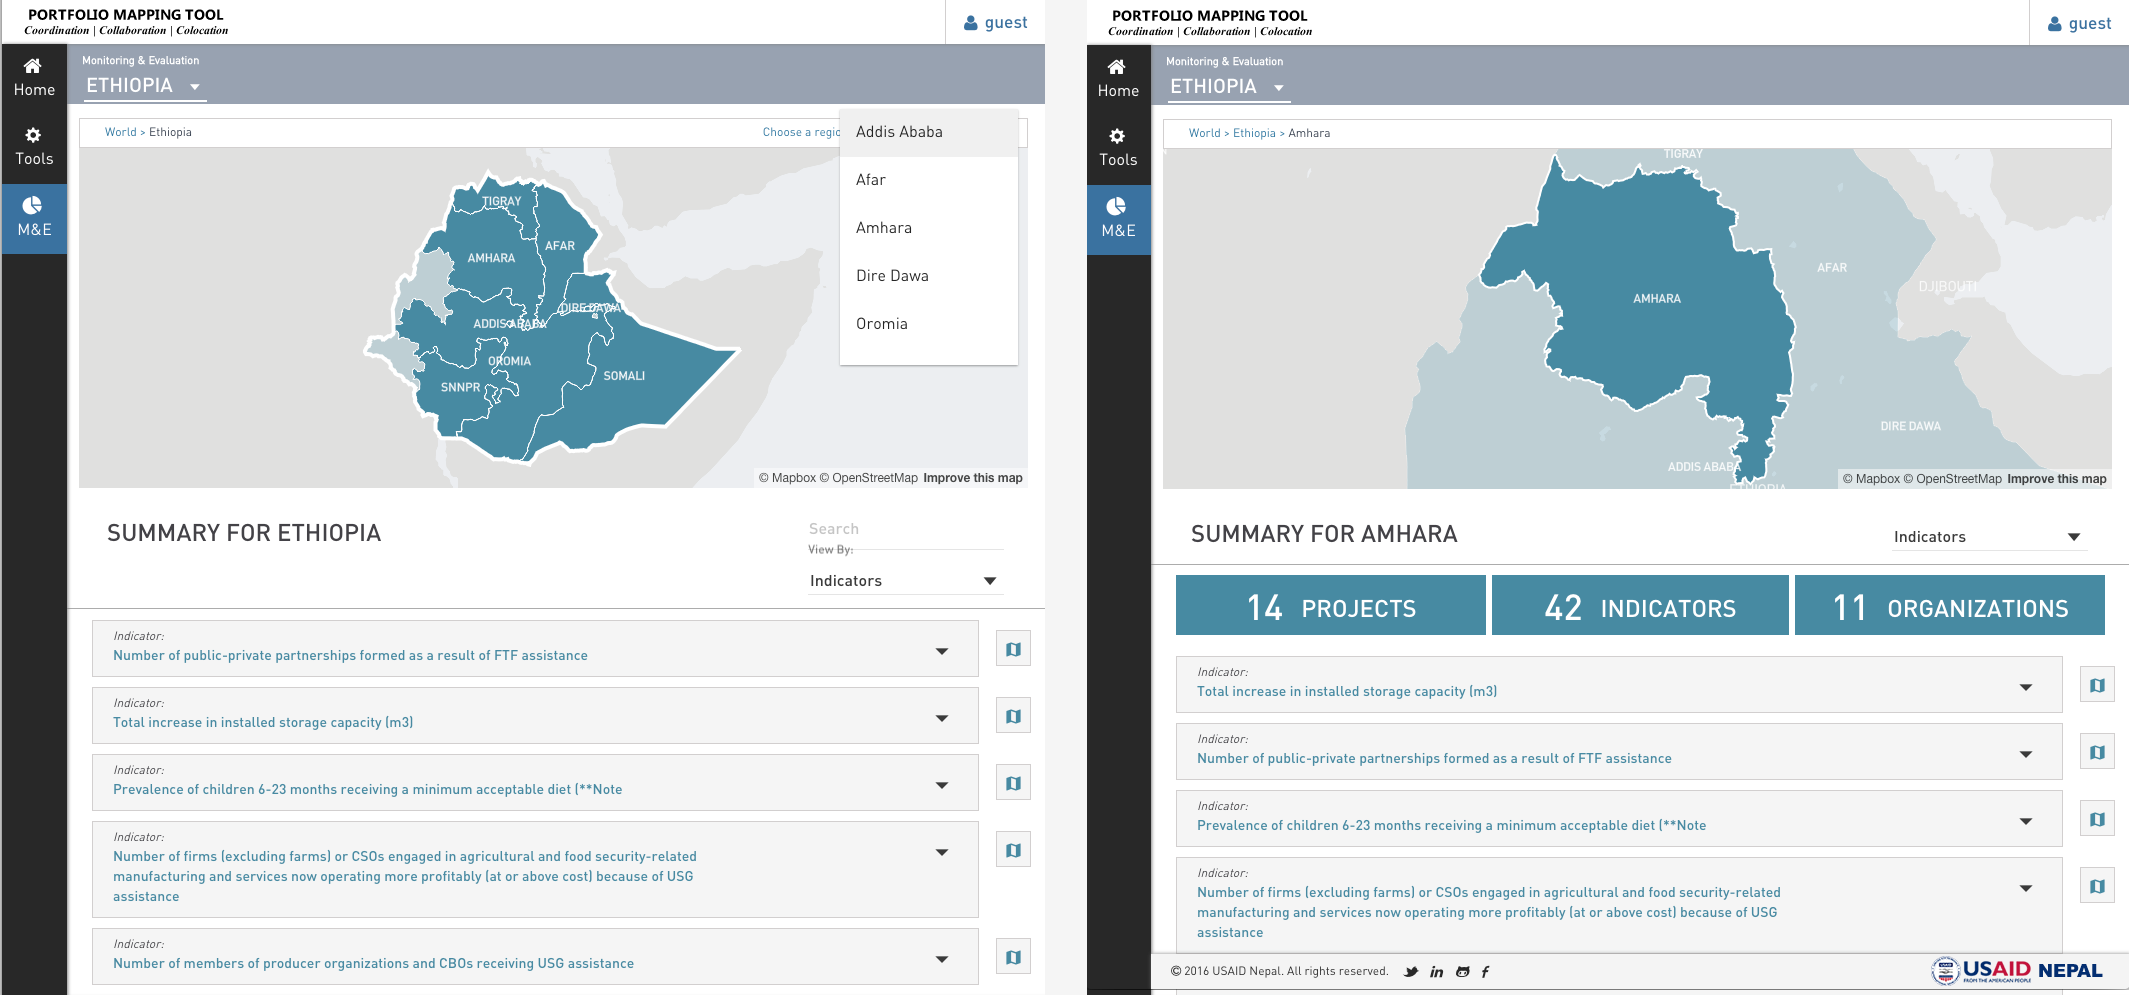
Within a particular country, Ethiopia for example, it can be observed that there are projects occurring in 8 sub-national regions; and within a particular region, Oromia for example, there are 15 projects occurring, 42 indicators being measured, and 12 organizations doing work within one sub-region.
Next, USAID wanted to understand where project locations are overlapping. The video below demos how one might investigate two projects in Ghana and see where they are each operating. In this example, it can be seen that the Peace Corps/FtF Partnership Initiative is operating in four sub-regions. The Agriculture Policy Support Project (APSP) is only occurring in one sub-region, Northern. As both of these projects are occurring in Northern, USAID or other partners operating in the field may be able to look at outcome data to determine whether there is a perceived benefit to having multiple projects operating in the same region. Understanding the high-level view of project locations is also important for identifying opportunities for better coordination and reduction in duplication of resources.
Lastly, USAID wanted to know if their projects are having an impact. This is a hard question to answer. Determining causality in project delivery is virtually impossible but there are a variety of tools one can use to make a judgement call. One approach for answering this question is by looking at the indicators that USAID has laid out for each project. For example, the Agricultural Growth Project - Livestock Growth Project (AGP-LGP) in Ethiopia tracks a number of indicators including:
• The value of exports of targeted agricultural commodities as a result of USG assistance
• The value of Agricultural and Rural Loans
• The number of people trained in child health and nutrition through USG-supported programs
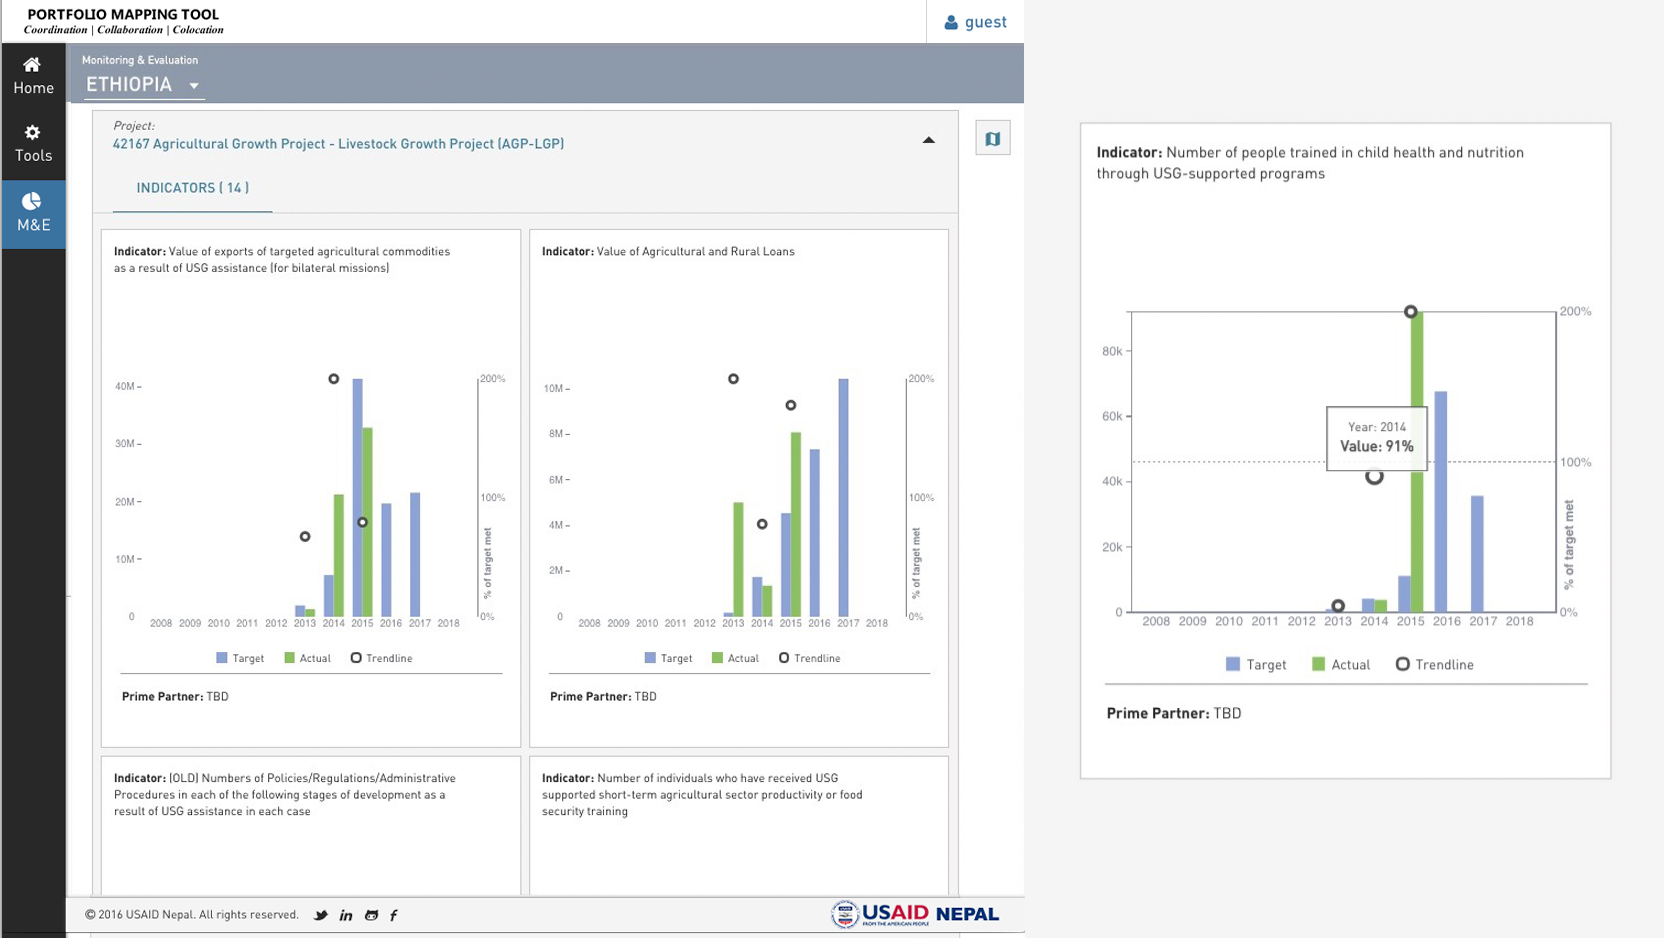
Diving into one of these indicators one can see that between 2013 and 2015 there was a rise in the number of people trained in child health and nutrition through USG-supported programs. Not only did the raw number rise, but the program increased its ability to hit its annual target. Looking at additional data from the regions in which the Agricultural Growth Project - Livestock Growth Project was operating, USAID can begin to assess whether training additional personnel had a positive impact at the micro-level. Additionally, this data can be used to better set future targets and improve the internal metric tracking system.