


Financial Access
A recent report by the African Development Bank (AfDB) cited only “23% of adults in Africa have an account at a formal financial institution” (Financial Inclusion in Africa, 2013). The extremely low number of account holders is a testament to Africa’s underdeveloped financial services, and has created a push for more financial access research.
Thanks to our forward-thinking clients, SpatialDev has had the opportunity to contribute to this research using geographic information systems (GIS) to analyze the proximity of financial services in sub-Saharan Africa and Asia. And as part of this work, we leveraged Walkshed analyses to increase the accuracy of the results.
We worked with a combination of location buffers, population rasters, and zonal statistics to generate the total population living within a 5km buffer of a financial service (5km is the approximate distance a person will walk within one hour). Using this information, we estimated the number of people within an hour’s walking distance of, for example, an ATM.
Below is an example of this buffer analysis. Notice the large portion of water protruding the buffer. While the buffer provides a great estimation, it is dependent on straight-line (crow’s flight) distance. This distance does not account for water bodies, roads, and other obstacles that might divert someone from walking in a straight line to their destination.
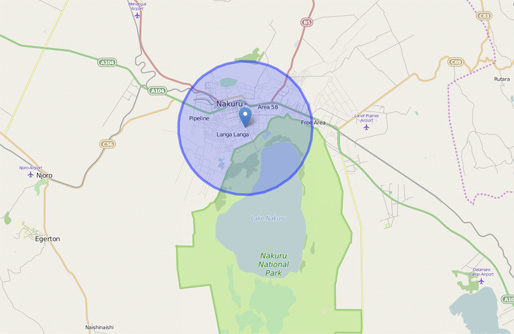
Buffer Analysis: Nakuru, Kenya
Luckily, there’s a way to improve the analysis results.
Walksheds
A Walkshed is a smarter buffer. It calculates the walking route from a given point to all other points within a travel time threshold using a transportation network (rather than Euclidean distance).
Here’s an example: 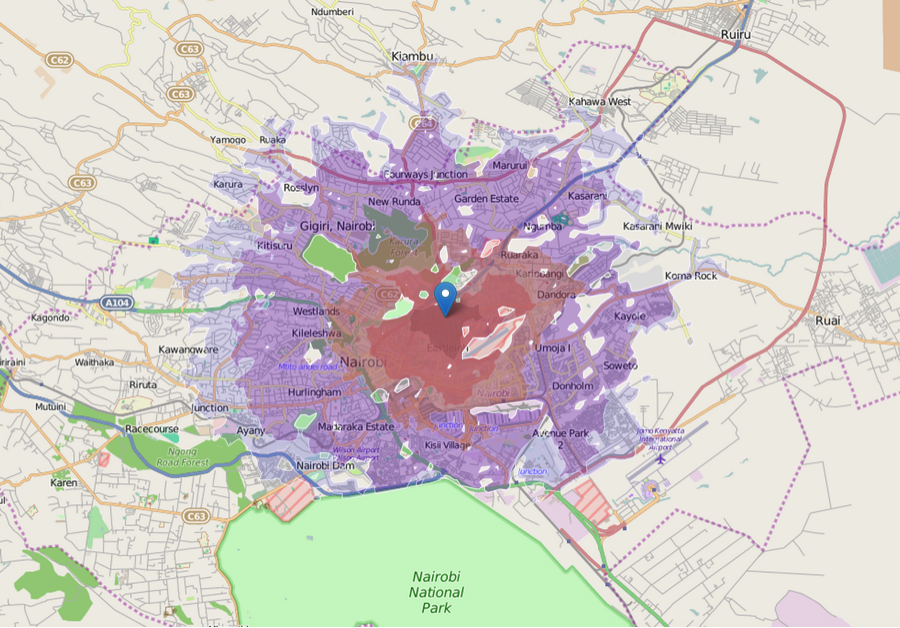 Walkshed Analysis: Nairobi, Kenya
In the example above, the blue marker represents a financial service point in Nairobi. Each color band represents an additional 10 minutes’ walk away from the marker’s location. A person in the dark purple region, for example, would need 40 minutes to walk to the blue marker. Notice there are two parks the Walkshed does not overlay – this is because the parks have no connecting roads.
When we compare results from the traditional buffer and the Walkshed, we see a more refined set of results that considers the impact of topography and infrastructure on access. The images below provide a comparison in results for the same location using both the traditional buffer (on the left) and the Walkshed isochrones (on the right).
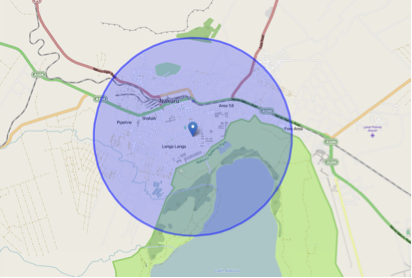 Total pop with 5km of point: 470,366
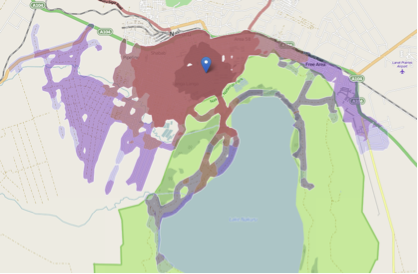 Total pop within an hour’s walk from point: 332,176
These Walksheds are a more effective way of measuring actual access to financial institutions. One tool SpatialDev uses in its Walkshed GIS analysis is OpenTripPlanner, an open-source multimodal routing service with analysis capabilities.
Using OpenTripPlanner’s API, we create Walkshed polygons (formally known as isochrones). We also use OpenStreetMap as the underlying transportation network. OpenStreetMap is the world’s biggest user-generated map. It is free to use and growing rapidly.
Use Cases
Growing market economies spur income growth and greater demand for services. These markets present opportunities for new industries. Walksheds are a great tool to locate services and industries.
How many customers will I be able to reach?
We can determine potential market size by combining Walksheds with population demographics (e.g. population density, income thresholds, education levels, etc.,).
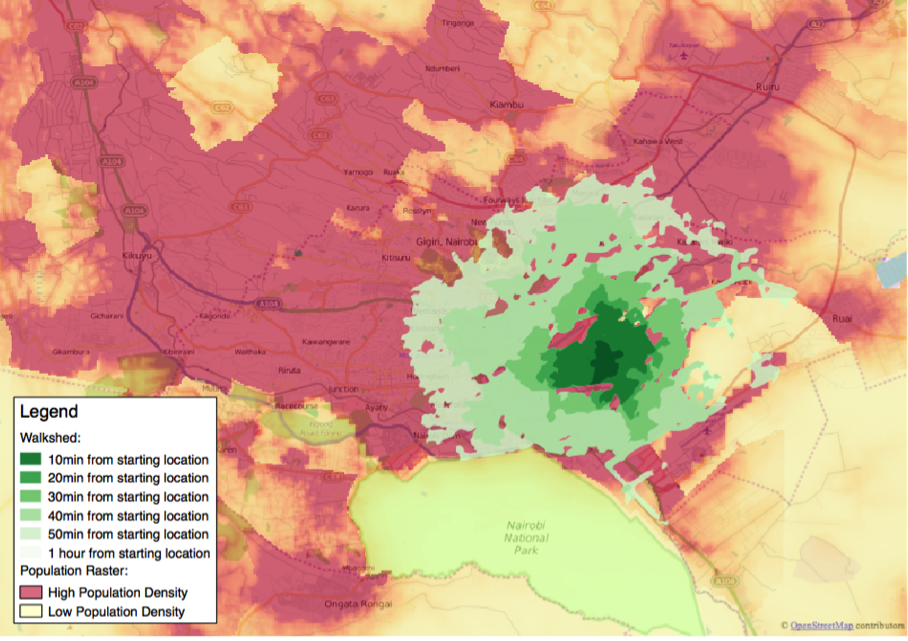 Walkshed Analysis and Population Density: Nairobi, Kenya
What is the landscape of nearby competition?
OpenStreetMap Points of Interest often include business locations. Walksheds and Points of Interest can determine which areas of the market are saturated, and which areas are opportunities for new services.
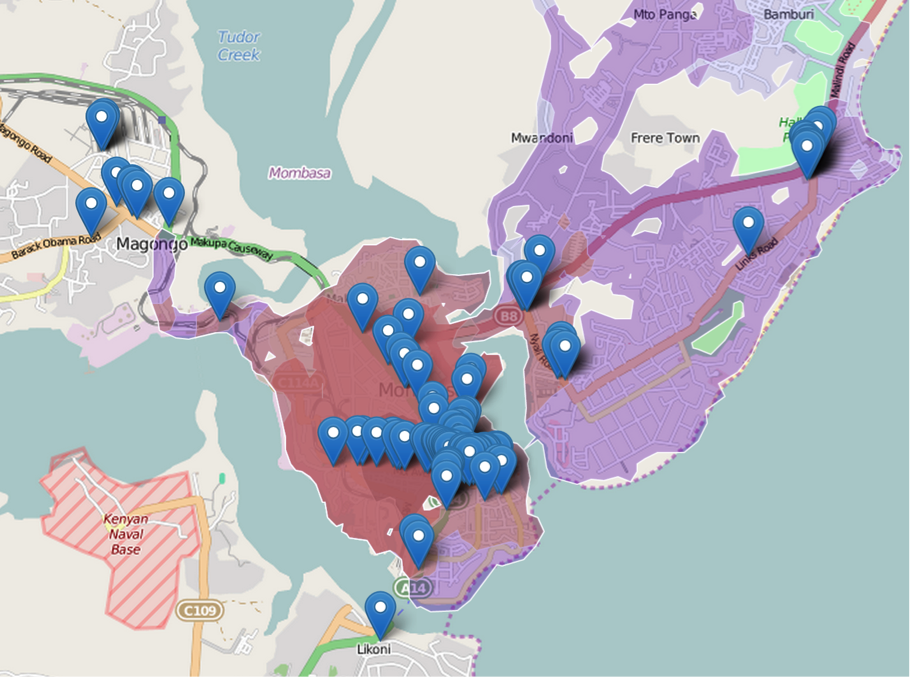 Commercial Bank locations and Walkshed Analysis: Mombasa, Kenya
What other conditions exist that will help my business?
Some businesses look to locate near complementary services. This type of agglomeration forms clusters of economic activity that fuel growth to scale. Business indicators include:
- The financial sector – can people get cash and credit nearby?
- Permit activity – where is the government approving new construction?
- Universities – where can I find talent and benefit from spillover from innovation?
- Ports and trade corridors – how can I put myself in the middle of the action?
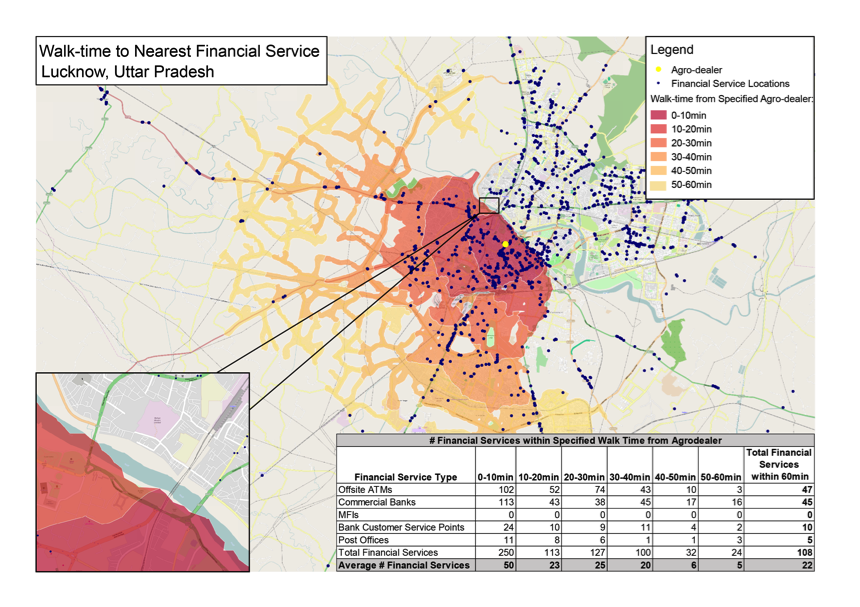 Financial Service and Walkshed Analysis: Uttar Pradesh, India
Where should I build a processing plant?
We recently used geospatial analysis and OpenStreetMap to determine the best location for an orange juice plant processing facility. We analyzed several potential sites, and compared which site would yield the most efficient transport of fruit with the lowest transportation costs.
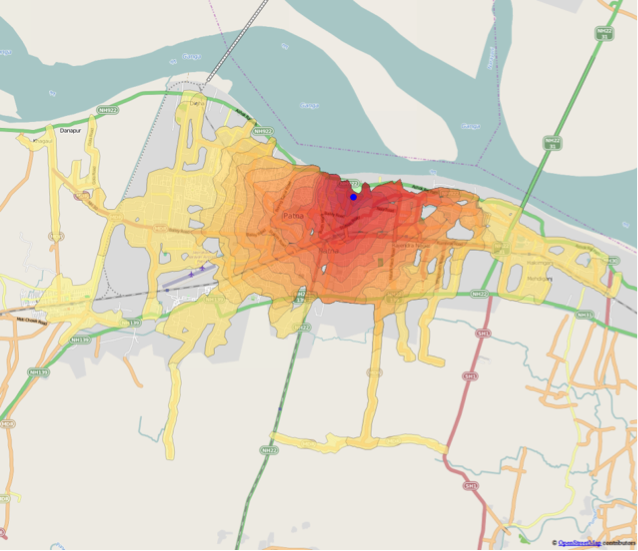 Uttar Pradesh, India
OpenTripPlanner: The Geeky Stuff
Interested in the details of what we’re talking about? Below is a little more detail about how we use OpenTripPlanner for Walksheds:
First, we install and configure an instance of the OpenTripPlanner server:
https://github.com/opentripplanner/OpenTripPlanner
Next, in order for OpenTripPlanner to generate routes and create Walksheds, we need a graph object. A graph is a collection of nodes and edges generated from a road network. The Shortest Path Tree algorithm will use these nodes and edges to calculate walking time from point A to point B. For some cool visuals of a graph, check out Brandon Martin-Anderson’s Graphserver gallery:
http://graphserver.sourceforge.net/gallery.html
To build a graph, we need to supply the OpenTripPlanner server with a road network extract. OpenStreetMap extracts (we use geofabrik or bbike for osm.pbf extracts) can range anywhere from a town to an entire country.
Once the server has built the graph using our OpenStreetMap extract, we can start the server, and make requests to OpenTripPlanner’s API. Laurent Gregoire’s OpenTripPlanner LIsochrones is the specific API we use to generate Walksheds.
Lisochrone documentation here:
http://koti.kapsi.fi/~hannes/build/docs/resource_LIsochrone.html
By specifying the start location, the travel time break points, and the mode of transportation, we can receive a json of calculated Walkshed polygons from the server. The Walkshed json can then be used as a layer in QGIS. The GIS possibilities abound!
Source:
Faye, Issa. Financial Inclusion in Africa. Rep. Ed. Thouraya Triki. African Development Bank (AfDB), 2013. Web. 24 July 2015.